
Google Analytics is widely deployed and extremely helpful to business owners, marketing managers and others with a vested interest in the success of a website. However, many businesses and organizations neglect to review and interpret the data that they’re collecting because they aren’t familiar enough with the resources that are available to them. We’ve begun by providing information about Audience data – helping you to understand who is visiting your website, in order to give you opportunities to optimize your conversion rates:
Overview
The main Audience → Overview reporting screen in Google Analytics will provide quick information at a glance, helping you to understand the volume of visitors that are arriving at your website for a given time period, along with other important factors, such as:
- Sessions – This figure tells you about the overall visits to your site.
- Users -This number helps you to understand how many visitors you’ve had. Keep in mind that a visitor can come back to your site, leading to more Sessions than Users.
- Pageviews & Pages / Session – These stats tell you about how many pages within your site people are visiting on average.
- Average Sessions Duration – This number will tell you how long people are spending on your website.
- Bounce Rate – This figure relates to people that come to your website, and then leave, without interacting with the site or going to additional pages within your site. A high bounce rate can often indicate visitors are unhappy with the information or site that they’re seeing.
- Percent of New Sessions – This percentage will help you to understand if you’re attracting new visitors to your site vs. if you’re engaging with old visitors enough to get them to return.
At a glance, these values will assist in determining if users are arriving at your site and how engaged they are when they get there. If they’re not visiting many pages, or leaving after a very brief visit, you’ll want to learn why and make sure that you’re attracting the right visitors and that the pages of your site are effective at capturing their interest.
User Explorer
These reports can help you to understand the browsing habits of individual anonymous visitors. In an E-commerce site, you can use your sales stats to identify ideal shoppers and better understand their journey with your site.
Demographics
While the demographics reporting requires that you accept certain terms in order to enable Google Analytics to collect this data for you, this reporting can tell you a lot about the makeup of your shoppers. This includes:
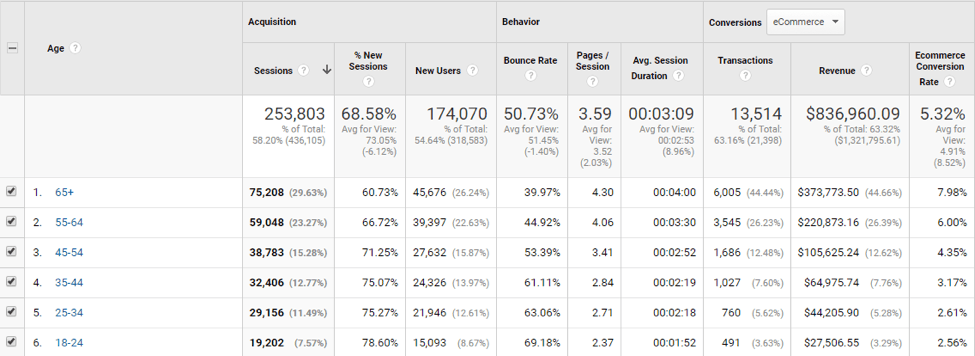
- Age – Google not only reports on breakdowns of your website visitors by age range, but also on revenue and conversion rates for each age range. This helps you to tell which groups of shoppers are spending the most money with you and which are more likely to make a purchase overall. This can be very helpful to your overall marketing efforts.
- Gender – Like age reports, gender reports include very useful data like revenue and conversion rate to help you to identify which shoppers are buying now and which are more likely to buy in the future if you market to them.
This data can also help drive your branding and design efforts, and can help inform your website’s user experience.
Interests
Interest data can help your marketing efforts by giving you insight into the things that interest your shoppers. This data can be used to both target marketing efforts toward these segments of potential shoppers and to help some of your website and marketing collateral speak to these interests.
Geo
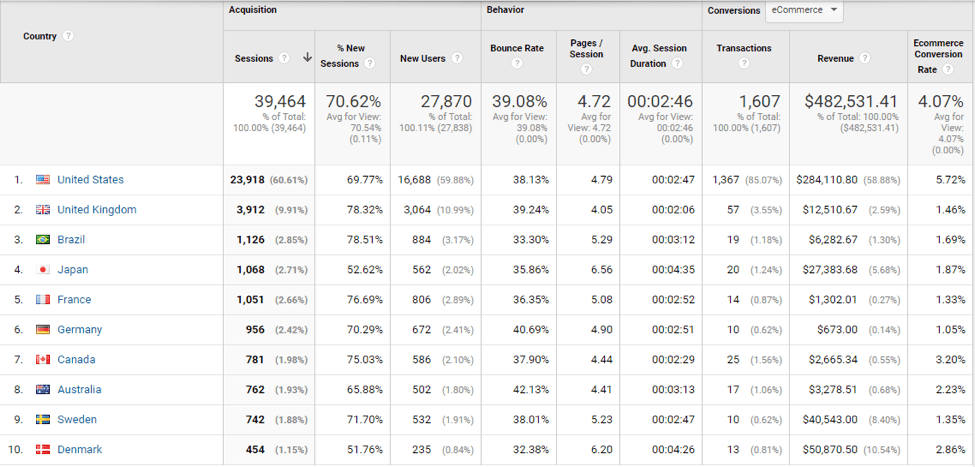
Geographic targets tell you about both where users are and what their primary language is. If, for instance, you see that you have a lot of interested shoppers from other countries, you may want to consider offering better shipping or payment methods for those consumers. If you see that you have a lot of shoppers whose primary language isn’t English, you may want to look into translating content to make it easier for these visitors to shop. Having your content in another language can also help you to rank organically in search engines like Google when a shopper searches in their native language.
Behavior
This section will tell you more about how visitors are engaging with your website by providing reporting, such as:
- New vs Returning – This report will tell you more about how many of your website visitors are repeat visitors vs. first-time visitors. This helps you to tell if you’re driving in new interest, or if you’re compelling shoppers to come back again. Hopefully, it’s a mix of the two. However, most shops will notice that their conversion rate from returning visitors – people already familiar with their brand – is higher.
- Frequency & Recency – This will help you to understand how many times shoppers, on average, are visiting your site and how many pages they’re visiting when they do.
- Engagement – This data helps you to better understand how long visitors spend on your website. While some shoppers will quickly glance at pricing or other information and move on, in general, you do want shoppers to stay for long enough to be engaged in the shopping process.
Technology
Tech information provided includes data such as which website browser technologies, operating systems, screen resolutions, and which internet service providers your shoppers are using. By cross-referencing this data with your conversion rates, Google Analytics can help you to find opportunities to improve your website. For instance, if you see that your conversion rates are lower than averages when users are on a certain web browser, you may want to test with that browser to see how user-friendly your website is in that browser. Similarly, if you see that shoppers with slower internet providers are less likely to make a purchase, you may want to consider optimizing your website’s loading speed.
Mobile
It’s no secret that most websites have been seeing regular increases in the percentage of visitors using mobile devices in recent years. However, many websites will have lower conversion rates on mobile devices. This is partly because some shoppers research on mobile devices, such as their smartphones, and switch to desktop when they’re ready to complete a purchase. However, there are things that can be done to increase mobile conversion rates, such as making your checkout faster and easier for those on a mobile device.
Google also provides information on traffic and conversion rates by device. If you find that your sales are lower than average for a particular device type, it may be worth testing your website on that device. If you don’t have one handy, there are emulators available on the web to simulate different devices and browser sizes for you.
Have questions? Whether you need help setting up your Google Analytics accounts, connecting it with an eCommerce platform like Magento, BigCommerce or Shopify, interpreting data or utilizing the collected data to optimize your website or drive in more targeted traffic, consider the help of a digital agency with strong eCommerce specializations.
To read part two of this series, please visit https://randmarketing.